
Experiments allow you to multi-test different versions of your Ingrid Checkout and gather statistical reports to determine which checkout variation performs better and brings you closer to achieving your goals.
What is A/B testing?
When launching Ingrid Checkout everyone has an opinion.
"Change this button to green and people will buy more”
“Let’s change the preselection order of delivery options and we will see more transactions”.
And while opinions galore, A/B testing is a quick and easy way to test them and see if they really hold water.
A/B testing - is one of the simplest and most effective way of research methodology. With A/B testing you can truly evaluate your conversion funnel and marketing campaign to get data directly from your customers behavior.
Experiments in Ingrid
We have recently noticed that our merchants get somehow conservative and restrictive in regards to making changes in their Delivery Checkout settings. Often, the first configuration stays the same until it is necessary to implement some changes.
After all, one of the general principles in e-com is that there's always room for improvement. Upgrading performance and boosting effectiveness should be your main goals, no exception. So why was it so common for our merchants to be hesitant with trying out new things?
The reason was either fear or confusion.
Why change the config when you can stick with the current one, working flawlessly? Every change is potential harm to your set-up and threat of additional hours of fixing.
Also, even if you make a change in the config, how would you know its impact? You'd have to guess that change A resulted in effect B, but you could never be 100% sure. There were no solid numbers to back up the thesis.
That's why we created Experiments. We want to encourage you to explore new possibilities of Ingrid, risk-free and in a measurable manner, with statistical data ready for your analysis!
How does it work?
Our Experiments work analogically as other A/B tests, allowing you to randomly present the users one from two or more versions of the Delivery Checkout. Later, you can fetch and compare data and see how each of the version performed.
Steps to configure:
1. From your Ingrid Merchant Platform Admin go to Delivery Checkout > Experiments.
2. Find the button "Create" and press it.
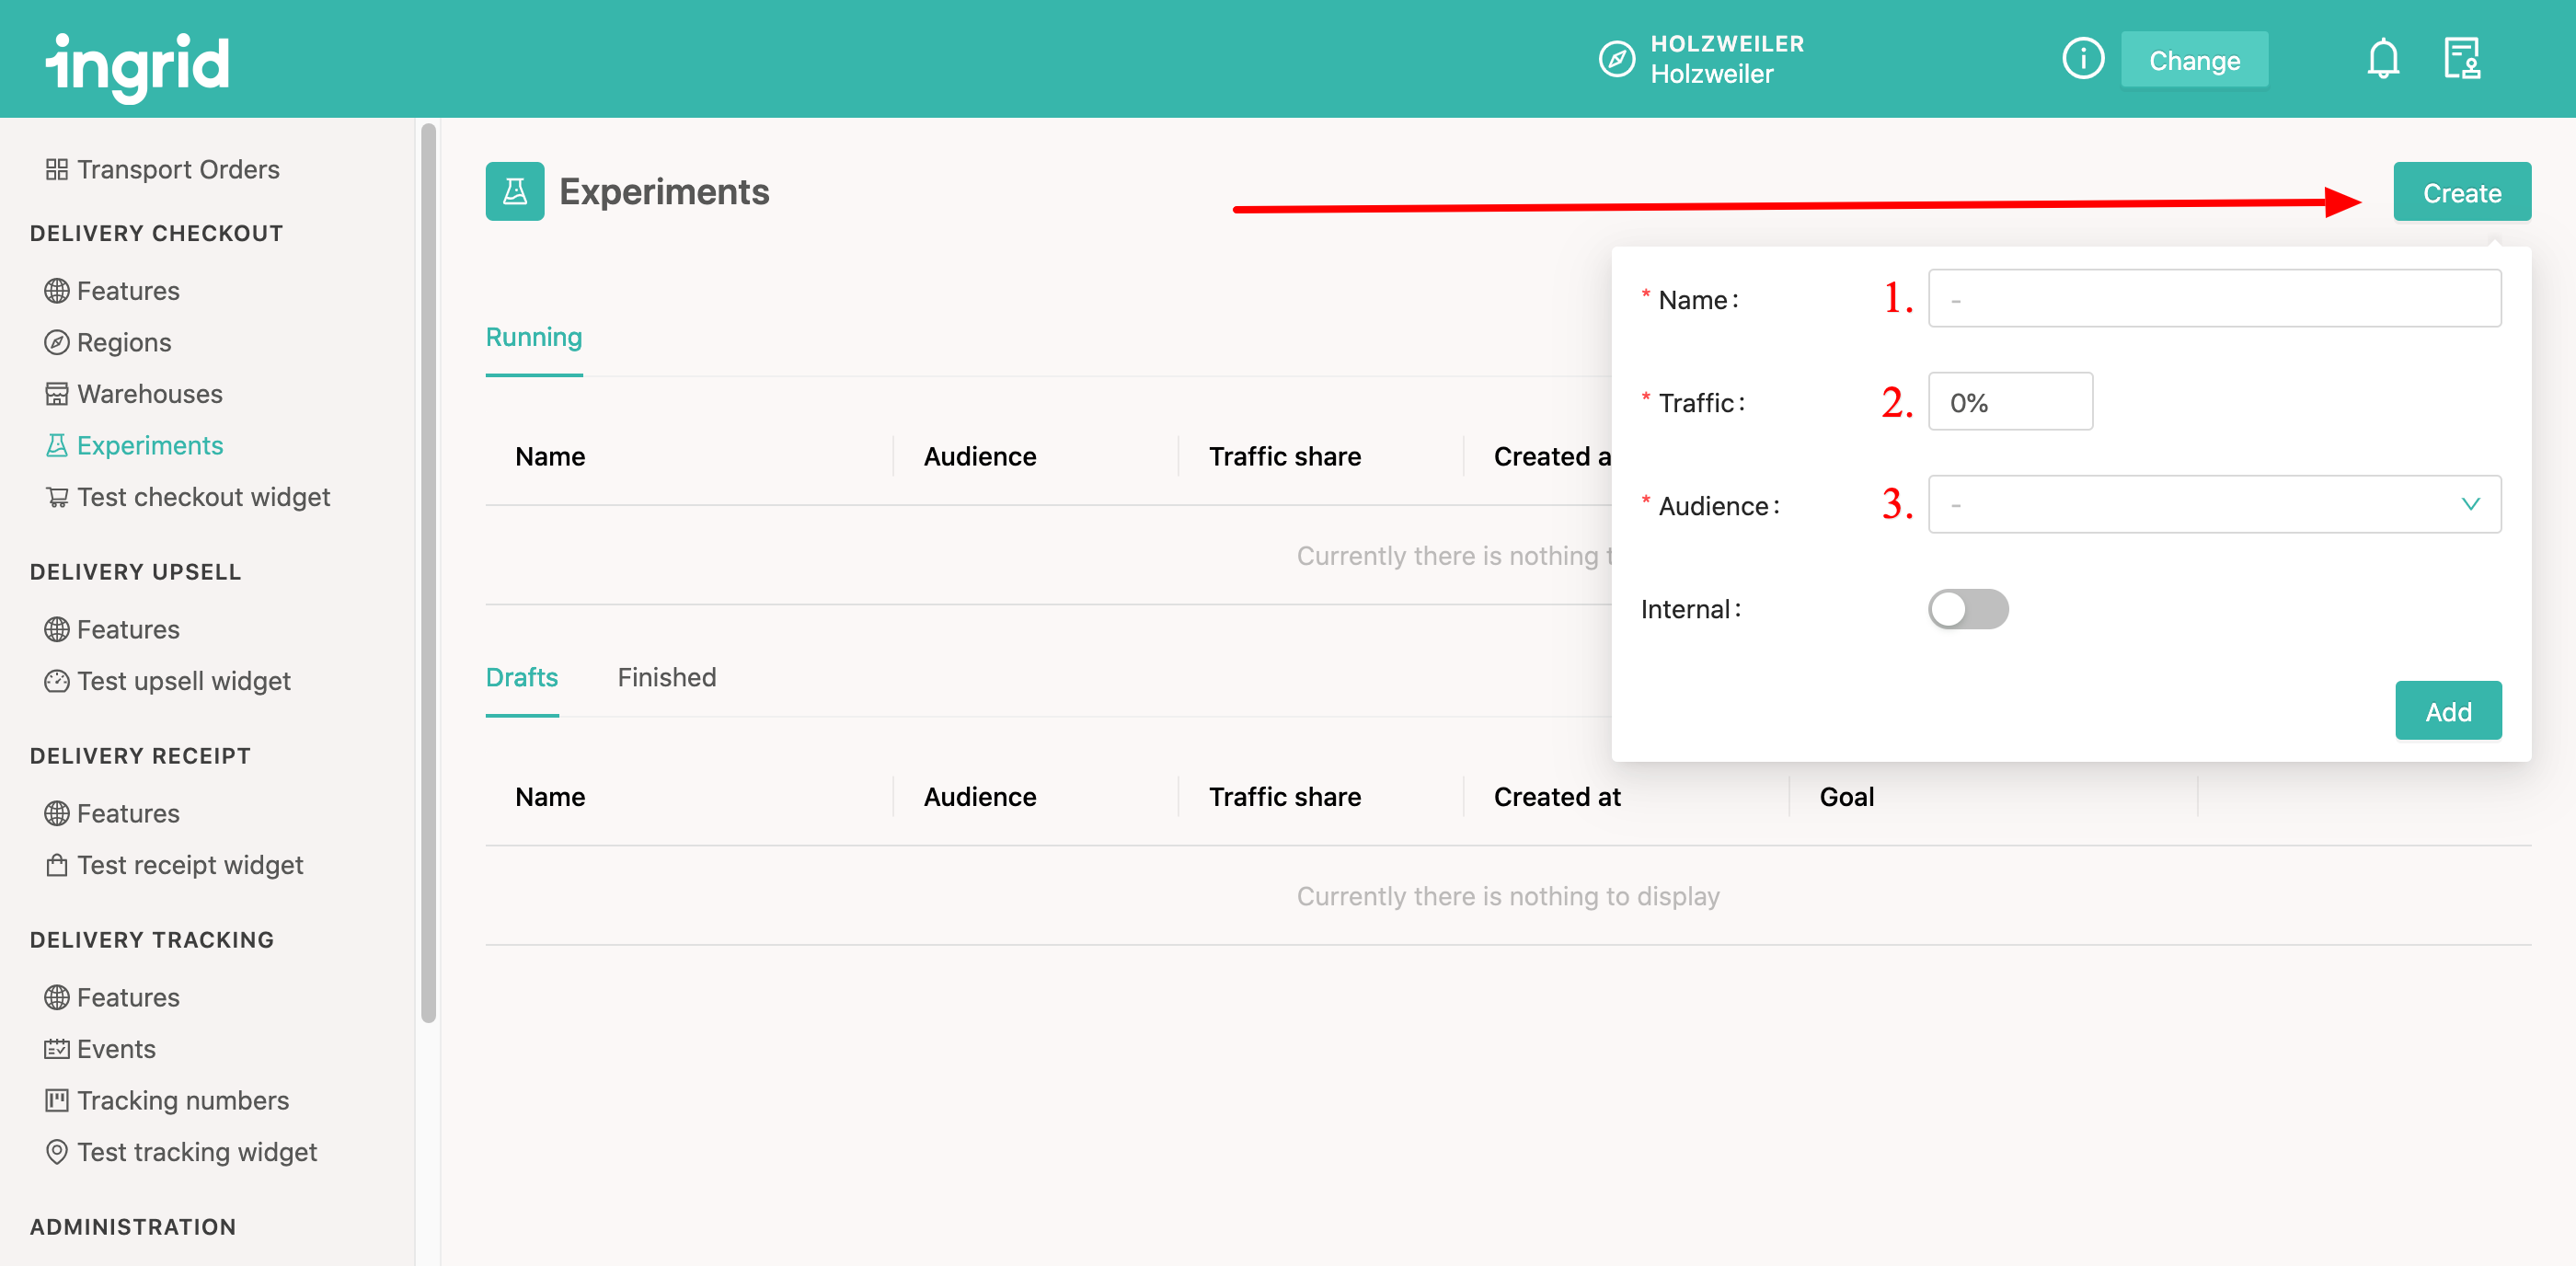
In the field no. 1 - set a name for the test. Hint: Make it as explicit as possible to later on know what the whole test was about.
In no. 2 - set up the traffic %. This value determines how many clients will be presented with the alternate versions of the checkout, comparing to the standard one.
In no. 3 - choose the Audience, which is the country, where you want to run the experiment.
Note: The toggle "Internal" toggle is for internal Ingrid's tests and should not be used by merchants, so just ignore it.
3. Click "Add" to save an experiment.
4. Click on the created experiment to detail it.
%20(1).png)
5. See the Experiment details page.
In the picture below you can see that I added two variants: Delivery higher price and Delivery lower price, as I'd like to see how alternating the delivery price will change my customer's behaviour.
To add a new variant simply click "Add new" on the bottom of the page.
.png)
My existing variants (Delivery higher price and Deliver lower price) don't have any practical value for A/B testing yet because they are equal to the actual price value. To differentiate them both it is needed to set some modifications on them.
6. Choose the variant and click "Modify".
.png)
From the "Modify" window, you can alternate Regions, Checkout Features, Warehouses. Practically you can introduce ANY kind of change to Regions, Features, Warehouse settings from here.
For example: we are looking into comparing 2 variants - higher and lower price. Hence we need to adjust the first variant to a higher value and the second variant to the lower value of the price.
Thus to edit the variant "Delivery higher price" we go "Modify" window > Regions tab > Carrier products > Choose a carrier product > Set a base price to a new value = 20.
.png)
7. Click "Modify" on the second variant "Delivery lower price".
From Modify window go to Regions tab > Carrier products > Choose the same carrier product as for the first variant > Set a base price to a new value = 5.
.png)
8. And voilà! You're ready to run your first test!
Hit the "Start" button.
Note: before hitting the "Start" button, you can click "Changes" (marked on the picture below) to double-check if correct variants were made and see how those alternatives differ from the current, original version of the widget.
.png?width=688&name=image%20(9).png)
For how long the experiment should be running?
.png)
You can end the test anytime you want, but we recommend to run it for at least 14 days to give you enough samples to receive reliable results.
.png)
Test results
After the test is finished, you can see its results. It's time for comparison and statistical analysis.
This is how the results page looks like:
.png)
- Improvement
- Results
- Test details
Let's look closer at the Results and Improvement.
Results
The bread and butter of our Experiments. Here you can see in detail (both percentage as well as numeric values) how your test performed and if it brought any conclusive results.
We use a few indicators to hint you if it's worth applying given changes to your live config or not.
- The first marker is Conversion Rate - a ratio between the number of started Sessions (where the checkout widget was triggered) and Completed Sesion (where the purchase has been finished).
- The second one is the Average Order Value (AOV), which indicates the average price of the products that were in the customer's cart at the end of the session, without shipping revenue.
- The third one is Average Shipping Revenue (ASR), presenting how much your customers paid for shipping on average.
- The last indicator is Average Total Revenue (ATR) combining two previous markers - AOV and ASR, showing you how the overall revenue will change depending on the variant.
Please note that in those cases "Average" is computed as a trimmed mean, discarding the top and bottom 10% of sessions in terms of revenue. It is applied to eliminate outliers that in some cases skew the picture of the general trend.
The last indicator presented in the Results table is Significance. A result being statistically significant refers to the claim that a result from experimentation is not likely to occur randomly or by chance, and is instead likely to be attributable to a specific cause. To increase the significance, more sessions need to be gathered in the experiment.
Significance is closely related to the so-called Confidence Threshold. The Confidence Threshold indicates the degree of confidence that the statistical result is conclusive. Unlike Significance, the Threshold is set by the experimenter in advance to determine whether experiment results can be considered statistically significant. It is customary to require a confidence threshold of 95% or sometimes 99% to consider the results statistically significant.
Improvement
This table shows you only the percentage changes between the different variants. Here you can see summarized values and get to know how each change influenced customers' behaviours without going into much detail.
F.A.Q.
You can find more questions and answers in our Experiments FAQ.